
By Antonio Hill
Three of the most popular articles for this question right now put fat FIRE at $200,000 a year, $150,000 a year, and $75,000 a year. Same term. Off by a factor of nearly three.
The short version is that Lean FIRE means roughly $40,000 a year of spending, chubby means somewhere around $100,000 to $150,000, and fat means whatever number is bigger than that in the mind of whoever wrote the article you’re reading. Nobody agrees, the lines move, and none of it is a fact.
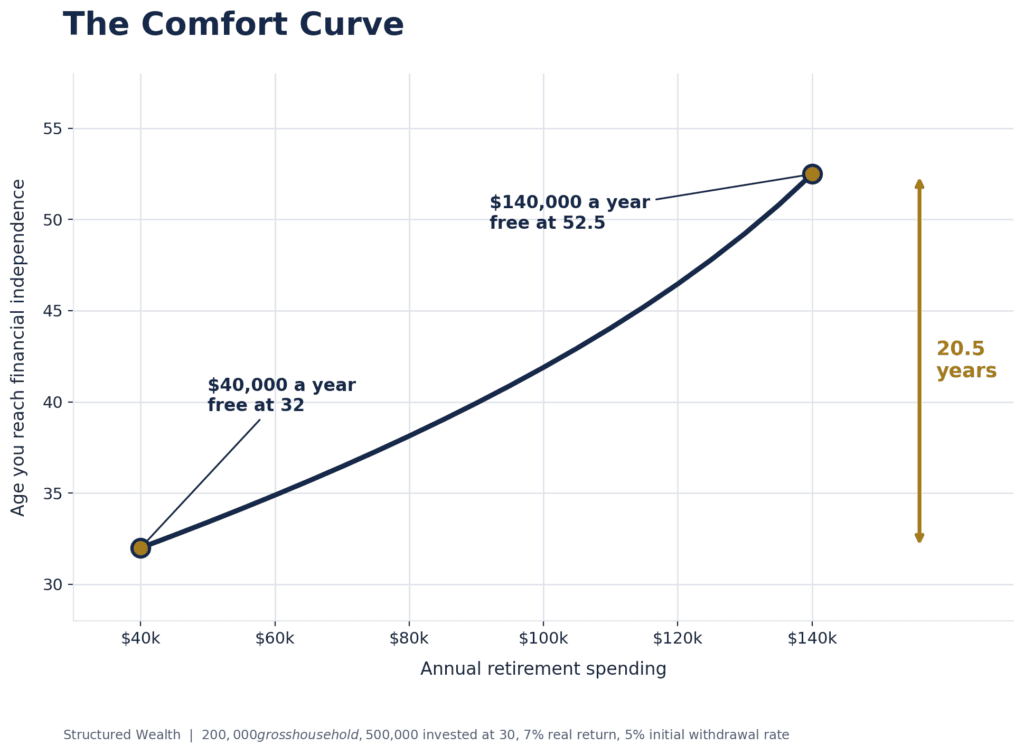
Here’s what is a fact. On a $200,000 household income, a $40,000 retirement gets you out at 32 and a $140,000 one gets you out at 52. Twenty and a half years apart, same person, same portfolio, same everything. That number is the actual difference between these tiers.
What Each Label Means, and Why Nobody Agrees
What Is Lean FIRE?
Lean FIRE means retiring on roughly $40,000 a year or less. Cheapest exit available, and the strictest. ProjectionLab puts it under $40,000, Kubera at about $40,000 or less, The Money Muse at $30,000. At a 5% withdrawal rate that’s $800,000 invested. Hold that against the fact that the average American household spends $78,535 a year, and lean FIRE turns out to be a promise to live at half the national average for the next fifty years.
What Is Chubby FIRE?
Chubby FIRE means retiring on roughly $100,000 to $150,000 a year, comfortable without being extravagant. Nobody owns the term though, so the floor slides depending on who’s writing. Kubera starts chubby at $80,000. The Money Muse starts it at $50,000. At a 5% withdrawal rate, $100,000 a year needs $2 million invested and $150,000 needs $3 million. If you want a chubby FIRE calculator rather than a table, run your own spending number through the calculator and it returns the portfolio and the age together.
What Is Fat FIRE?
Fat FIRE means retiring on more than chubby, and that’s as precise as the definition gets. ProjectionLab puts the floor at $200,000 a year. Kubera says $150,000. The Money Muse says $75,000. At 5%, those floors need $4 million, $3 million, and $1.5 million. Three sources, one word, portfolios that differ by $2.5 million.
I pulled the definitions off three of the results competing for this exact search and put them side by side. Read across the rows.
| Source | Lean FIRE | Chubby FIRE | Fat FIRE |
|---|---|---|---|
| ProjectionLab | under $40,000 | $100,000 to $200,000 | $200,000 and up |
| Kubera | about $40,000 or less | $80,000 to $150,000 | $150,000 to $500,000+ |
| The Money Muse | about $30,000 | $50,000 and up | $75,000 and up |
Look at what happens around $78,000 a year. That’s fat FIRE according to The Money Muse, which puts the floor at $75,000. It’s not yet chubby according to Kubera, which starts chubby at $80,000. The identical budget is simultaneously affluent and not-quite-comfortable depending on which browser tab you have open.
Or take $120,000, which happens to be my own target. Chubby to ProjectionLab. Chubby to Kubera. Solidly past fat to The Money Muse. I Will Teach You To Be Rich puts chubby at $80,000 to $150,000, which overlaps two of the three columns above.
These aren’t obscure blogs disagreeing in a corner of the internet. They’re the results Google is showing you for this question.
Worth noticing who writes most of them. ProjectionLab sells financial planning software. Kubera sells a net worth tracker that runs $250 to $2,500 a year and is marketed at high net worth individuals. Their chubby and fat definitions describe portfolios complicated enough to need the product. I’m not accusing anybody of lying. I’m pointing out that a definition with a subscription attached to it isn’t a measurement.
ProjectionLab, to its credit, says the quiet part out loud. Their page notes the ranges aren’t official definitions and that you’ll find different numbers depending on who you ask. That’s the most honest sentence on the entire results page, and it’s buried under a table that looks authoritative.
The Only Difference That Matters Is Years
Every one of those pages sells you a destination. Not one tells you the price.
Across that whole results page I found exactly two sentences about time, both on ProjectionLab, and they contradict each other. One says a household earning $200,000 with a 50% savings rate might reach chubby FIRE in 12 to 15 years. The FAQ on the same page says a household saving $100,000 a year might reach $3 million in 15 to 20 years. No math shown either time.
So I ran it.
Why the Price Climbs the Higher You Go
Raising your retirement target hits you twice, and the second hit is the one nobody models.
The first hit is obvious. Spend $20,000 more per year and your target grows by $400,000 at a 5% withdrawal rate. Fine. Everybody knows that one.
The second hit is that the money funding the bigger lifestyle is the same money that would have been compounding. You don’t live at $60,000 for fifteen years and then flip a switch to $120,000 the day you quit. If you plan to spend $120,000 in retirement, you’re spending roughly $120,000 now, and that difference comes straight out of your contributions.
Bigger target, smaller engine, at the same time. That’s why the price of comfort climbs the further up you go, and it’s why a single point estimate is useless.
A $200,000 gross household income, roughly $150,000 after tax, $500,000 already invested at age 30, 7% real returns, 5% initial withdrawal rate. Only the retirement lifestyle changes.
| Annual spending | Portfolio needed | Invested per year | Free at age |
|---|---|---|---|
| $40,000 | $800,000 | $110,000 | 32.0 |
| $60,000 | $1,200,000 | $90,000 | 34.9 |
| $80,000 | $1,600,000 | $70,000 | 38.1 |
| $90,000 | $1,800,000 | $60,000 | 39.9 |
| $100,000 | $2,000,000 | $50,000 | 41.9 |
| $120,000 | $2,400,000 | $30,000 | 46.5 |
| $140,000 | $2,800,000 | $10,000 | 52.5 |
Read the right column. That’s the article.
$40,000 gets you out at 32. $140,000 gets you out at 52.5. And the age climbs faster than the spending does. Go from $40,000 to $80,000, doubling your lifestyle, and you add six years. Go from $100,000 to $140,000, the same $40,000 jump, and you add more than ten. The second half of that table is far more expensive than the first half, dollar for dollar.
Notice there are no tier labels on it. That’s deliberate. Find the number you actually want on the left, read the age on the right, and you’ve learned more than every definition table we discussed earlier.
The Bill That Isn’t in the Model
That curve understates the cost of climbing it.
The enhanced ACA premium tax credits expired on December 31, 2025. As of January 1, 2026 the original rules came back, which puts the subsidy cliff at 400% of the federal poverty level back in play. One dollar over and your premium tax credit goes to zero. According to KFF, average marketplace deductibles jumped 37% to a record $3,786 for 2026, and sign ups among households just above that cliff fell 44%.
Spending more doesn’t automatically push your income over the line. What counts is modified adjusted gross income, not spending, which is the whole game behind engineering a near zero tax retirement. But the higher you climb, the more of your spending has to come from somewhere taxable, and the less room you have to maneuver. I walk through that math in the ACA cliff piece.
Both Ends of That Curve Are Stranger Than They Sound
Before you pick a spot, look at what these numbers mean.
The Bureau of Labor Statistics released its 2024 Consumer Expenditure Survey in December 2025. Average annual household spending in America came to $78,535. The top income quintile averaged $150,342. Married couples whose oldest child is between 6 and 17 averaged $117,355.
Now hold those against the labels. The $40,000 that everyone files under lean is roughly half of what the average American household spends. Not half of what rich people spend. Half of average. Retiring at 32 on that isn’t beating the system, it’s agreeing to live at half the national average for fifty years so you can stop working sooner.
And the $140,000 at the far end, the one that costs twenty extra years, is barely above what a normal married couple with school age kids already spends without calling it anything. A house, two cars, groceries, and youth sports. Neither of those cars is the brand new Corvette I financed at 24 because that is what I thought making money was supposed to look like.
So the entire vocabulary is off. This community calls the bottom of that table admirable and the top of it luxurious, when the bottom sits well below average and the top sits close to ordinary. Twenty years of your life get spent inside a range most of the country would just call normal.
Some people should take the cheap end. A single person with no kids, no mortgage, and cheap taste, who genuinely doesn’t want more, gets an enormous amount of life back for it. I believe them when they say they’re happy.
My Number, and Why I Won’t Take Less
I wanted a PlayStation 3 the year it came out. I asked in the spring. I got it at Christmas. My parents weren’t necessarily broke and they weren’t necessarily cheap. They just never had the money ready when I was ready. Years later, I bought the PS4 and the PS5 on release day with my own money, and I finally understood what I’d actually been asking for back then. Not the console. The timing.
That’s the whole reason I won’t shave my number to get out sooner.
My target is $120,000 a year in today’s dollars. I’m not retired yet, so I don’t know what my final number will be, and anybody who tells you their post-retirement spending with confidence before they’ve lived it is guessing. What I do know is the rule I’ve set for myself. I reach $120,000 or I don’t retire. There’s no version where I take $90,000 and leave at 38 instead.
So to answer the question this whole debate keeps circling. Yes, the extra years are worth it. I’d rather work until 41 with the life I want than quit at 32 into a life where my daughter waits until Christmas.
That’s my answer. Yours can be completely different and still be right. What can’t be right is picking a tier without knowing what it costs.
I use a 5% initial withdrawal rate, not 4%. That comes from Jonathan Guyton and William Klinger’s 2006 paper in the Journal of Financial Planning, which tested “the probability of sustaining an initial withdrawal rate for at least 40 years” and found that retirees willing to flex their spending could start at 5.2% to 5.6% with at least 65% in stocks. I break that down in my guardrails article, and it’s also why I think the 4% rule is a dumb rule of thumb for a forty year retirement.
The Floor I Can’t Actually Promise You
Flexible withdrawals aren’t free. They work because you agree in advance to cut spending when the market turns on you, and history says those cuts get ugly.
Derek Tharp and Justin Fitzpatrick ran Guyton and Klinger’s rules through real market history for Kitces in 2024. Retiring into the Global Financial Crisis meant a 28% cut. The dot com bust, 36%. The Great Depression produced what they call a “45% spending hole”. They ran that at a 4.3% starting rate. Mine is higher, so mine would be worse.
My floor, the lowest number I’d still walk away on, is $90,000. There is a second number most people never set, which is the ceiling on what you are willing to die with, and skipping it is how a plan quietly turns years of your life into an inheritance nobody asked for. That’s a 25% cut from target. The Global Financial Crisis would have taken me to $86,400 and blown straight through it. The dot com bust, $76,800. The Great Depression, $66,000, which is most of the way back down that curve to a life I just told you I wouldn’t accept.
So the floor is a preference. It is not a limit. A bad enough sequence of returns overrides what I want, and no amount of planning changes that.
What I can control is the order things are cut in, because I’ve already decided it. Travel first. Eating out second. Extra family experiences third. Anything that affects my family’s lives in a meaningful way will be last.
How to Price Your Own Number
All of this runs on the same three levers. Time in the market, what you contribute, and what it grows at. Raising your target lifestyle is the only move that attacks two of them at once, which is exactly why it costs more than people expect.
Do this in the next hour.
- Stop trying to figure out which tier you’re in. Three page-one results can’t agree and it has never once changed anybody’s outcome.
- Write down what you actually spend now. Not the budget. The bank statement.
- Write down the number you want in retirement, and be honest that free time makes every day feel like a Saturday and Saturdays cost money.
- Find both on the Comfort Curve. The gap between them is your price in years. Then decide whether that many years is a fair trade for the difference between those two lives.
- Write your floor, then cut it by another 30% and ask whether you’d survive that, because history says you might have to. Rank what gets cut first, second, third, while nothing is on fire.
Then run it with your real income in the Structured Wealth calculator. If you’re still sizing the target itself, start with how much you actually need to retire at 40, and if you want the accumulation side, here’s how I got to a million by 33 on an engineer’s salary.
Lean, chubby, fat. Twenty and a half years sit between the ends of that table, and not one of those three words tells you that. Pick your number, price it, then go earn it.
Picking a target without ever pricing it in years is one of the ten mistakes I watch smart, high earning people make while they’re convinced everything is on track. Send me the guide
Your number is the first of four decisions in the full withdrawal plan. See where it leads.
Common Questions
What is the difference between lean FIRE, chubby FIRE, and fat FIRE?
Broadly, lean FIRE means around $40,000 a year of retirement spending, chubby means roughly $100,000 to $150,000, and fat means more than that. But the sources disagree sharply. ProjectionLab starts fat FIRE at $200,000, Kubera at $150,000, and The Money Muse at $75,000. The more useful difference is time. On a $200,000 household income, the spread between a $40,000 retirement and a $140,000 one is twenty and a half years of work.
How much do you need for chubby FIRE?
At a 5% withdrawal rate, $100,000 of annual spending needs $2 million and $150,000 needs $3 million. At 4% those become $2.5 million and $3.75 million. The portfolio is the easy part to calculate. The harder question is how many working years that portfolio costs you, which depends on your income and what you’re spending while you build it.
Is fat FIRE worth the extra years of work?
For me, yes. My target is $120,000 a year and I’ve decided I reach it or I don’t retire. On the curve above, that same choice costs the model household about fourteen years compared to leaving on a lean number. Whether it’s worth it for you depends on how many years it is at your income, and that’s a number you can calculate rather than argue about.
Why does a higher retirement number cost more years than you would expect?
Because it hits from both sides. A higher retirement lifestyle raises the portfolio you need and lowers what you can invest each year, since you’re living at that level while you accumulate. The target grows while the engine shrinks, so the curve steepens the higher you climb.
Does a smaller retirement number help with health insurance?
It can, quite a bit. The ACA subsidy cliff at 400% of the federal poverty level returned in 2026 after the enhanced credits expired. Lower reported income makes it far easier to stay under that line, though what matters is modified adjusted gross income rather than what you spend.
I’m not a licensed financial advisor and none of this is financial advice. It’s my own research and my own plan. Competitor definitions were pulled from the live pages in July 2026 and linked so you can check them. The free guide linked above puts you on my email list, where I also sell The Early Retirement Blueprint, the Plan Builder, and a bundle of both. Make your own decisions.