
By Antonio Hill
Let me be clear about something right up front. I am not saying the market never goes down. It does, often, and those drops can feel brutal when you’re watching your portfolio lose 20% in a matter of weeks. I am not predicting future gains or guaranteeing things will always work out. Markets go down. Sometimes a lot.
What I am saying is this. When you look at the complete historical record of the US market, every single downturn so far has resolved itself. Not most of them. All of them. And the people who got “crushed” along the way were not the ones who stayed invested and kept contributing. They were the ones who panicked, sold, and locked in their losses right at the bottom.
That gap between what the market earns and what the average investor actually earns is where early retirement goes to die. And it is a far bigger gap than most people realize.
This Conversation Is About the Accumulation Phase
Before we get into the data, I want to draw a hard line. Everything in this article applies to people still in the accumulation phase. If you are in your mid 20s to late 30s, still working, still putting money in every month, and not yet pulling anything out of your portfolio, this is for you.
The math changes significantly as you approach retirement. Once you start withdrawing instead of depositing, sequence of returns risk becomes real and you have to plan around it. Tax strategy matters more when the numbers get big and you have to manipulate income. Healthcare coverage needs a plan. The way you structure your withdrawals affects how long the money lasts. I cover that territory in depth in my article on why the conventional 4% rule is more conservative than most early retirees actually need. It deserves its own space entirely.
But if you are 10 or more years from the date you plan to stop working? The rules right now are genuinely simple. Get money in the market. Keep it in. Remove yourself as a variable.
Why a Market Drop Is Actually Good News During Accumulation
A market correction during your accumulation years is not a bad thing. It is a buying opportunity.
When the market falls 30%, every dollar you invest that month buys roughly 43% more shares than it did at the previous price. These are real shares of real US companies, and every time the market has fallen, it has eventually recovered and gone higher. Every one of those extra shares recovered with it. You got a 30% off sale on the index. The investors who kept buying through every major crash in US history did not just survive. They came out well ahead of anyone who panicked and stepped away. And the people who are serious about retiring early? They were contributing even more than normal during those times.
Time and compounding do the rest. You just have to stay in the game.
Volatility Is Not the Same Thing as Risk
Risk means permanent loss of capital. Volatility means the price went down temporarily. These are completely different things. And treating them as the same thing is what causes most investors to make decisions that genuinely hurt them.
The S&P 500 dropped 34% in 33 days during the March 2020 COVID crash. Violent, nauseating, relentless drops day after day for over a month. But by August 2020, the market had fully recovered. If you had put $10,000 in at the absolute peak in February 2020, right before the crash, you would have watched it fall to around $6,600. If you did nothing at all and just left it alone, you were whole again before the summer ended.
That is not risk. That is the price to play the game.
Volatility Is Built Into the Plan, Not a Break From It
Think about how most investors respond when the market drops. They treat it like something went wrong. Like their strategy broke. Like they need to act immediately or risk losing everything.
But a drop is not a malfunction. It is the expected operating condition of a healthy market.
Here is the number that should reframe how you see every scary headline. Since 1980, the S&P 500 has fallen an average of about 14% at some point during the year. Every year. That is the typical, normal, built-in drawdown. And despite that, the index has still finished the year positive in roughly 3 out of every 4 of those years, according to J.P. Morgan’s Guide to the Markets. Big intra-year drops and positive yearly returns are not contradictions. They happen in the same years, constantly.
After the market bottoms, recoveries have historically been faster and sharper than the panic suggests, and the bull markets that follow have run far longer than the bears that came before them.
So the next time the market drops and every financial news outlet tells you the sky is falling, understand what you are actually witnessing. A completely normal, historically expected, well-documented event. A good plan already priced this in. The volatility is not an interruption to the plan. It was always part of it.
The Market Has a Perfect Record So Far
Ask yourself honestly which of these two scenarios is more likely:
The United States economy collapses permanently and never recovers from the next recession or crash. Everything goes to zero and stays there.
You get scared watching your portfolio drop, let the relentless anxiety of financial media convince you this time is different, and abandon a solid plan at exactly the wrong time.
One of those has never happened in the history of the US market. The other happens constantly. Can you guess which?
The US market survived World War I and World War II. It survived the 1918 flu pandemic that killed 50 million people globally. It survived the Great Depression. It survived the stagflation of the 1970s. It survived the dot com bubble wiping out trillions in 2000. It survived a terrorist attack that shut down the entire financial system in September 2001. It survived a complete global banking collapse in 2008 that the world’s top economists were genuinely unsure about. It survived COVID in 2020. It survived the fastest Federal Reserve rate hiking cycle in 40 years in 2022.
After every single one of those events, the market came back and went higher.
That is not me selectively pulling the good years. That is the full unedited record. According to Fidelity’s data, the S&P 500 has averaged roughly 11% a year over the last two decades, including every one of those crises. Including the ones that felt unsurvivable while they were happening. Roughly 3 of every 4 calendar years in the S&P’s history have ended positive once you include dividends. The Nasdaq has averaged around 13% a year over the last 20 years, and with technology and AI becoming core infrastructure across the economy, I honestly expect that strength to continue. That last part is my opinion, not a guarantee, so weight it accordingly.
Now, the honest objection, because there is a real one. This is the US market I am describing, and the US has been the single best performing major market of the last century. That is survivorship talking, at least in part. Japan’s Nikkei hit a high in 1989 that it did not see again for more than 30 years. So no, a perfect record is not a law of physics, and I am not promising you one. Here is why I still build my entire plan on broad US and global equity anyway. The US has the deepest, most diversified corporate base on the planet, spread across every sector, constantly replacing its losers with new winners. And owning an international index alongside it covers the single country tail risk directly. I am betting on capitalism broadly, not on one company, one sector, or even one country. That bet has a far better track record than betting against it.
The market does not need your confidence and emotional stability to keep working, but your portfolio absolutely does.
If you do not have a written plan for exactly what you’ll do when the market drops 20%, you’ll make an emotional decision under pressure. Download the free guide, 10 Quiet Mistakes That Kill Your Early Retirement, and make sure the biggest threat to your portfolio is not you.
The Investor’s Track Record Is a Different Story
DALBAR is a financial research firm that has published the Quantitative Analysis of Investor Behavior every year since 1994. Their 2025 edition covered investor behavior through December 2024. The numbers are not flattering.
The S&P 500 returned 25.02% in 2024. The average equity fund investor earned 16.54%. That is an 848 basis point gap, the second largest investor shortfall recorded in the last decade. And it was not a fluke of one bad year. In 2024 the average investor pulled money out of equity funds on net, the ninth straight year of outflows, and most of it left during or right before the market’s best stretches. DALBAR’s Guess Right Ratio, which measures how often investors time their moves correctly, fell to 25% in 2024. One in four. The average holding period for an equity fund dropped to 4.79 years, barely half a typical market cycle.
Now, DALBAR’s method gets criticized for overstating the gap, so here is the more conservative number too. Morningstar’s Mind the Gap study, the stricter of the two, found investors earned 7.0% a year over the last decade while the funds they actually owned returned 8.2%. That 1.2 point annual gap means the average investor left roughly 15% of their own funds’ returns on the table. Not to fees. To timing.
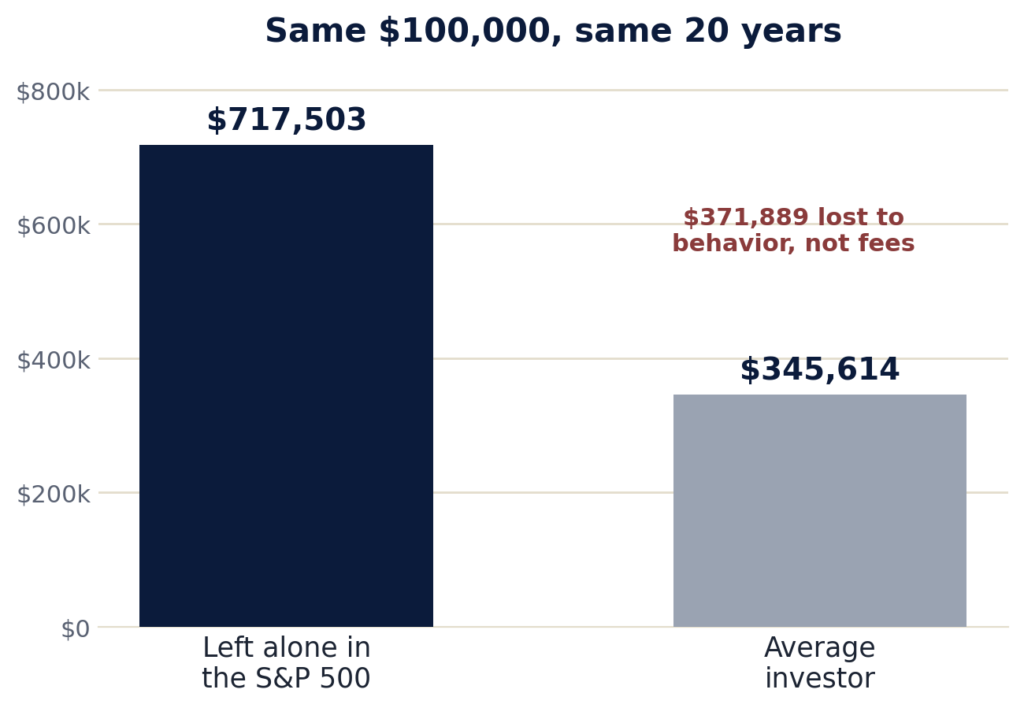
And over a longer horizon, that gap compounds into something brutal. Kirr, Marbach and Company ran DALBAR’s data over 20 years. A $100,000 buy and hold position in the S&P 500 grew to $717,503. The average investor, moving in and out at the wrong times, finished with $345,614. Same market. Same two decades. Behavior cost them $371,889, more than half the gain.
Warren Buffett described this dynamic better than any research paper ever will. “The stock market is a device for transferring money from the impatient to the patient.”
That’s pretty much how it works. Every. Time.
What Actually Gets People to Sell at the Bottom
It is not stupidity. I want to be clear about that. Smart people with decent incomes and finance degrees have panic sold at market bottoms. People who have read every investing book ever written have done it. Understanding the psychology of it matters because it can happen to anyone who has not made a decision about it in advance. Myself included. The first quarter of 2020 and the fourth quarter of 2022 were when I learned these lessons the hard way, and I definitely knew better, especially in 2022.
What moves someone to sell is the feeling that this time is different. That this specific crash is the one that does not come back. That somehow the last 100 years of market history does not apply to the current situation.
The uncomfortable part is that every major crash in history has come with a compelling narrative for why things would not recover. In 2008, mainstream financial analysts were genuinely questioning whether the global banking system would survive the year. In March 2020, economists were comparing COVID to the 1918 Spanish flu and projecting decade long depressions. In 2022, with inflation at 9.1% and the Fed hiking rates faster than any point in 40 years, nearly every major financial outlet was forecasting a severe multi year recession.
In every single case, the market recovered faster than the narrative predicted.
The narrative is always scariest at the bottom. And the bottom is exactly where you want to be buying. Honestly, it is where you want to be buying even more than normal. These days, the thing that actually upsets me during a downturn is not having as much extra cash as I want to buy with, so I am stuck sticking to my normal contributions.
What Doing This Right Actually Looks Like
Keep your automated investments running. If you have extra cash sitting in a high yield savings account waiting for the right moment, understand that the right moment according to the data is always now, and during a downturn it is even more so. Do not check your portfolio every day. Do not read financial news obsessively during a crash. Do not touch your allocation.
During the accumulation phase, if your time horizon is long and you are not close to pulling money out, 100% equities is a reasonable position. The data supports it. The Nasdaq’s roughly 13% annual average over the last 20 years supports it. I have no interest in holding bonds during accumulation when the math makes a case that strong for staying in stocks. That is my position, and you can take it or leave it. The research isn’t subtle, though.
Morningstar’s Mind the Gap research backs this from another angle. The more volatile, complex, or trendy a fund is, the wider the behavior gap gets, because it tempts people to trade. Simpler, steadier holdings leave less room to sabotage yourself. Nick Maggiulli, who runs the data blog Of Dollars and Data and wrote Just Keep Buying, has analyzed dollar cost averaging across nearly every historical market scenario on record. His finding holds up across almost every period he studied. Investors who kept buying through downturns, especially the ones who bought near the bottoms, dramatically outperformed the investors who tried to time their way in and out.
Staying in is the strategy. I know that sounds too simple. It is that simple.
Write the Plan Before You Need It
Most investors do not fail because they lack knowledge. They fail because they never decided in advance what they would do when things got bad.
When the market drops 30% and every news headline is screaming about economic collapse, that is not the time to be forming a response strategy. You will make a fear based decision. That is just how humans are wired. The emotional weight of watching your net worth fall week after week is real, and it tends to overwhelm logical thinking in real time, no matter how financially literate you are. Ask me how I know.
Write the plan now, while you are calm. You can read how I approach this whole journey in my piece on building close to seven figures before 33 without a windfall or a lucky stock pick. My plan for any downturn is short. Keep the automated investments running, and have cash ready to buy more. That is it. I made that decision when I was not scared, which is exactly why I have not deviated from it since 2020. You need to make the same call, in writing, before you actually need it.
What Changes When You Get Close to Retirement
Everything above applies to someone still in the accumulation phase. If you are 10 or more years from your exit date and contributing consistently, volatility is genuinely not your enemy right now. Time is doing the work. Your job is to not get in the way of it.
But this changes as you get close to retirement. When you shift from depositing into a portfolio to withdrawing from it, a bad sequence of early returns can damage your long term outcome in a way that time cannot fully fix. That risk is real and it requires a real strategy around withdrawals, taxes, and how your accounts are structured.
If you want to understand where I land on withdrawal rates, and why the standard 4% rule almost certainly inflates the number you actually need to retire, my article on why the 4% rule is too conservative for flexible early retirees covers the research from Guyton, Klinger, and Bengen in detail. The work on guardrail based withdrawals supports rates meaningfully higher than 4%, which moves your target number in a big way.
For now, though, do not let retirement phase complexity bleed into accumulation phase thinking. They are genuinely different problems requiring different approaches. Right now, during accumulation, the task is straightforward. Invest consistently. Automate everything you can. Stay out of your own way.
The market has survived everything the last century has thrown at it and kept going. The only thing here with a shaky track record is the investor standing between their paycheck and the index.
Manage yourself. That is the only risk that actually matters right now.
Frequently Asked Questions
Is volatility the same as risk?
No, and confusing them is an expensive mistake. Volatility is a temporary drop in price. Risk is a permanent loss of capital. A broad index that falls 30% and recovers was volatile, not risky. You only convert volatility into real, permanent loss by selling while it’s down. If your money has years to sit before you spend it, volatility is noise you ride through, not a threat you defend against.
Should I sell my stocks when the market crashes?
If you’re still in the accumulation phase, no. Selling during a crash locks in the loss and almost always means missing the recovery, which historically arrives faster than the headlines predict. The market’s best days tend to cluster right after its worst ones. A crash during accumulation is closer to a sale than an emergency, because every contribution buys more shares at a lower price. Keep your automated investing running and, if you can, add more.
How big is the behavior gap, really?
It depends on the study, but it’s always negative. Morningstar’s Mind the Gap, the more conservative measure, found investors earned 7.0% a year over the last decade versus 8.2% for the funds they owned, a 1.2 point annual gap. DALBAR, which uses a wider methodology, found an 8.48 point gap in 2024 alone. Over 20 years that compounds hard. Kirr Marbach calculated that $100,000 left alone in the S&P grew to $717,503, while the average investor ended with $345,614. The gap is behavior, not fees.
Should I keep investing during a recession?
During accumulation, yes, and arguably more than usual. Downturns are when shares go on sale, and history shows the investors who kept buying through them, especially near the bottoms, came out well ahead of those who waited for an all-clear that never rings. The risk in a recession isn’t staying invested. It’s letting fear pull you out at the worst possible moment.
You can’t control the market. You can control whether you’re the one variable that blows up the plan. The free guide, 10 Quiet Mistakes That Kill Your Early Retirement, lays out the quiet behavioral traps that wreck early retirements before people even notice them. Grab it, write your plan, and take yourself off the list of risks. Send me the guide.
This is a voice piece, my own opinion and analysis, not personalized financial advice. The free guide above puts you on my email list, where I also sell The Early Retirement Blueprint. I am not compensated by any fund company or advisor mentioned here.