
By Antonio Hill
There isn’t one number. For the same couple, retiring at the same age, spending the same money, I can defend a taxable brokerage bridge of $920,000 or $1.54 million. Both are correct. They’re just answers to different questions.
So what actually decides it? Not your age. Not the five year conversion ladder rule. Your annual spending measured against the ACA subsidy cliff, because that is what determines how much of your retirement the Roth conversion ladder is allowed to carry.
There are three strategies below, each one modeled year by year through 2026 tax brackets and 2026 premiums. Each shows what you need in taxable at retirement and what it costs you over the 19.5 years to 59½. One of them is what I’m doing, and I’ll tell you why I still think it’s right for me and why the math says it probably isn’t right for you.
Where the Five Year Answer Comes From
Search this question and everybody says five years. That number isn’t a risk calculation. It’s the seasoning period on a Roth conversion, straight out of Section 408A, and the clock starts January 1 of the year you convert. Convert in December and it matures in a hair over four calendar years. I walked the mechanics in the Roth conversion ladder example with real numbers.
So five years measures one thing. How long your first rung sits before you can touch it. It tells you nothing about how much money you should have.
The real question underneath is a split. Every dollar of early retirement spending comes out of either your taxable account, your roth contributions, or your conversion ladder, and the ladder is cheap. Michael Kitces has been making this point for a decade. His finding is that the most efficient approach spends taxable while “filling the tax brackets early on” with partial conversions, rather than letting the pretax account compound into a bracket problem later.
That means a bigger bridge is not automatically better. Every dollar you park in taxable is a dollar that didn’t buy you a deduction at 24% or 32% while you were working, and that you would have pulled back out through the ladder at roughly 6% to 8% effective. Overbuild the bridge and you hand back the single best arbitrage in early retirement.
But you can’t just convert your whole spending either. Conversions are ordinary income, and ordinary income is MAGI, and MAGI is what the ACA cliff measures. Blow past 400% of the poverty line and every dollar of premium subsidy vanishes at once. For a household of two in 2026 that line sits near $84,600. I covered the mechanics in the subsidy cliff piece.
So the ladder is cheap but capped. Taxable is uncapped but expensive to build. Your bridge size lives exactly where those two collide.
The Three Ways To Fund a Bridge
Ladder first. Hold five years in taxable and nothing more. Convert your full annual spending every single year starting the day you retire, and from year six onward the ladder pays for everything. Smallest bridge of the three. You will blow the subsidy cliff the moment your spending clears roughly $80,000, because your conversion alone puts you over.
Subsidy first. Cap your conversions at whatever keeps MAGI under the cliff. Taxable covers the rest, every year, all the way to 59½. Bigger bridge, near zero federal tax, subsidy intact.
Taxable first. Fund all 19.5 years from the brokerage on its own. Convert whatever room is left over, but never plan to spend the converted money. Biggest bridge. Maximum flexibility.
What Each One Actually Costs
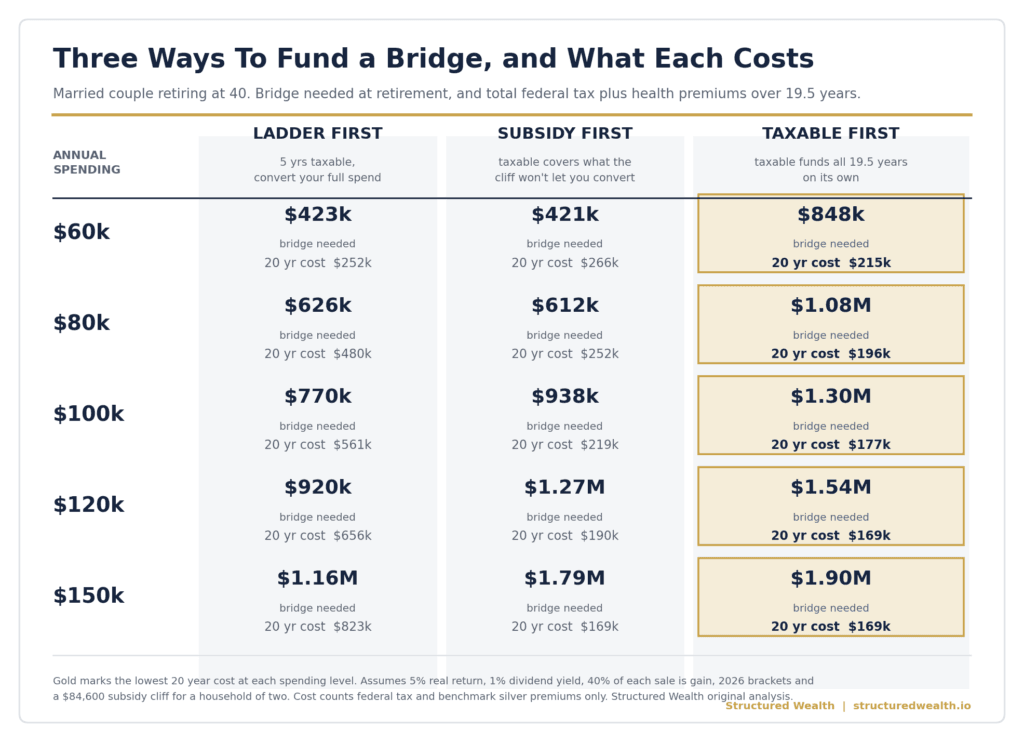
The Crossover Sits Near $80,000 of Spending
Read the $60,000 row first, because it’s the cleanest in the table. Ladder first needs $423,000 and the subsidy first needs $421,000. Effectively the same number, and that’s the whole point. When your spending fits under the cliff, converting your full spend doesn’t cost you the subsidy, so the ladder just works. You need about seven years of expenses in taxable and the pretax account handles the other twelve.
Now watch it break. At $80,000, the two bridges are still close, but ladder first costs $479,827 across the bridge against subsidy first at $252,241. Your conversion has crossed the line and you’re buying unsubsidized coverage. At $150,000 that same choice costs $822,975 versus $168,666. You saved $639,000 on the bridge and paid $654,000 for the privilege.
That’s the crossover, and it lands near $80,000 of annual spending for a couple. Below it, build small and lean on the ladder. Above it, the ladder can only carry part of the load and taxable has to cover the gap for the full span.
One Caveat This Table Cannot Show You
Everything here measures the bridge years only. It stops at 59½. Taxable first posts the lowest cost in every row partly because it barely touches the pretax account, which means that account keeps compounding into an RMD problem at 75. The bill doesn’t disappear. It moves past the edge of the table. I picked that thread up in how much pretax is too much, which puts a number on the largest balance you can still clear cheaply.
Where You Land in That Range Comes Down to Two Mistakes
Whether you’re building a $420,000 bridge or a $1.5 million one, two things decide it, and both are in the free guide. Sequence of returns risk is mistake nine. Getting too conservative too early, which is what strangles a bridge account’s growth, is mistake two. Ten total, each with the math behind it.
What Moves Your Number More Than Your Age Does
Spending against the cliff picks your strategy. But two people can pick the same strategy, spend the same money, retire the same year, and still need bridges that differ by half a million dollars. Here’s everything that does that, biggest lever first.
Embedded Gain Can Blow the Cliff Without a Single Conversion
This is the factor I see discussed almost nowhere, and it moves the number more than anything except your spending.
When you sell shares, only the gain counts as income. Your basis comes back untaxed and completely invisible to MAGI. So a brokerage account you’ve been stuffing for the last four years behaves nothing like one you’ve been compounding since 2014, even if the balances match to the dollar.
Run the same couple at $120,000 of spending and vary only the share of each sale that’s gain.
| Embedded gain | Bridge needed | Gains from one year of spending | Dividends | Conversion room left under the cliff |
|---|---|---|---|---|
| 15% | $1.57M | $18,000 | $15,686 | $50,914 |
| 30% | $1.55M | $36,000 | $15,469 | $33,131 |
| 45% | $1.54M | $54,000 | $15,404 | $15,196 |
| 60% | $1.56M | $72,000 | $15,617 | None. Cliff already blown. |
| 75% | $1.63M | $90,000 | $16,346 | None. Cliff already blown. |
Read the bottom two rows twice. At 60% embedded gain, funding your own spending throws off $72,000 of capital gains plus $15,617 of dividends. Against an $84,600 cliff that leaves negative $3,017. You lost your entire premium subsidy without converting one dollar.
On the subsidy first strategy the same swing moves the bridge itself from $1.06 million at 15% gain to $1.63 million at 75%. That’s a $570,000 range from one variable most people never measure.
Read the bridge column again, because it moves the opposite way from what you would guess. More embedded gain does not drain your bridge faster. It shrinks your conversions, which means less conversion tax leaving the account, so the bridge requirement actually eases until the gain gets bad enough to blow the cliff outright and premiums take over. Bad basis does not cost you a bridge. It costs you pretax money you never got to move.
Two things fix it, and both happen before you retire. Harvest gains deliberately while your income is low, resetting basis upward at a 0% federal rate, which is the same machinery behind realizing $131,100 tax free. And elect specific identification as your cost basis method now, not later, so you can sell your highest basis lots first and keep early MAGI down. The same $100,000 withdrawal can throw off three times the taxable income depending on which lots go, which I broke down in how much of your taxable account is actually unrealized gains.
The Cliff Reprices Every Year You Get Older
Losing your subsidy isn’t a fixed penalty either. Insurers price by age on a federal curve, where a 40 year old carries a factor of 1.278 and a 59 year old carries 2.603. Same plan, roughly twice the premium, purely for getting older.
| Your age | Unsubsidized benchmark, couple | What you’d pay at the cliff | Annual cost of blowing it |
|---|---|---|---|
| 40 | $11,928 | $8,426 | $3,502 |
| 45 | $13,477 | $8,426 | $5,051 |
| 50 | $16,669 | $8,426 | $8,243 |
| 55 | $20,813 | $8,426 | $12,387 |
| 59 | $24,295 | $8,426 | $15,869 |
Ignoring the cliff at 40 costs you $3,502 a year. Ignoring it at 59 costs $15,869. Four and a half times worse for the identical decision.
So the strategy should not stay fixed for twenty years. In your early forties the subsidy is small and the conversion arbitrage is large, which argues for converting hard and eating the premium. By your mid fifties the subsidy is worth more than the tax you’d save, and you throttle conversions down to protect it. Do the cheap conversions while they’re cheap, then get out of the way.
That shifts your bridge math in a useful direction. You don’t need taxable to carry the same load every year. You need it heaviest in the back half, which is also the half you have the longest to grow into.
And those are only the two biggest. Here’s the full set, ranked by how hard each one pulls on the number.
| What it is | Which way it pushes | How much it moves the bridge |
|---|---|---|
| Spending against your cliff | Decides which strategy you can run at all | The entire decision |
| Embedded gain in taxable | More gain, less conversion room, bigger bridge | Up to $570,000 at $120k spending |
| Years to 59½ | Every year earlier is another year to fund | Roughly one year of spending each |
| Household size | Bigger household, higher cliff, more conversion room | $62,600 single up to $128,600 for four |
| Roth contributions already made | Withdrawable at any age, so they cut the bridge directly | Dollar for dollar with what you’ve contributed |
| Dividend yield inside the bridge | Forced MAGI you cannot switch off | $6,400 a year at 0.5% yield, $38,200 at 3% |
| Size of the pretax balance | No ladder without one, RMD problem with too much | Sets the ceiling on what the ladder can carry |
| Return sequence in the first decade | A bad start means selling more shares for the same spending | Roughly a third larger at 1% real |
| State tax on conversions | Some states tax them, some have no income tax at all | Shifts the arbitrage, and I ran all fifty states |
| Any earned income | Consulting or part time work eats MAGI room | Dollar for dollar against your conversion budget |
| Tax loss carryforwards | Offset realized gains, freeing MAGI room | Dollar for dollar, and they never expire |
| Unreimbursed HSA receipts | A stealth bridge account nobody counts | Whatever you’ve banked and never claimed |
| Cost basis election | Specific identification lets you sell high basis lots first | Lowers effective embedded gain in the early years |
| 72(t) or the Rule of 55 | Skips the five year wait, but locks you into a payment schedule | Can shrink the bridge toward nothing |
| Policy risk | The cliff vanished in 2021 and came back in 2026 | Unknowable, which argues for margin |
If you want one takeaway from that table, take this. Four of the top six are things you control years before you retire, not decisions you make on your way out the door. Spending, basis, household, and asset location all get set during accumulation. Which is the whole reason this gets planned early instead of discovered at 39.
What I’m Doing, and What It Takes To Run It
I’m running taxable first, and I’m running the managed version of it, because the unmanaged version is the trap I just described.
Three moving parts. The brokerage will fund our spending from day one. I’ll convert every year starting the first year, sized to fill whatever MAGI room is left under the cliff after dividends and realized gains. And I control the gain side on purpose, selling my highest basis lots first instead of letting the brokerage hand me whatever the default is.
That third piece is the one doing the work, and here is what it produces. We are a family of four, which puts our cliff at $128,600 rather than the $84,600 in the table above, and I hold myself to the 10% buffer I argue for in the subsidy cliff piece. So my working line is $115,740.
Retiring at 40 spending $120,000, the brokerage throws off $19,000 in dividends and my sales realize about $31,346 in gains. That is $50,346 of income I never chose, before I convert a dollar. The room left underneath is $65,394, which is exactly what I convert. MAGI lands on $115,740 with the actual cliff still $12,860 away. Federal tax that year comes to $3,487.
Run that every year and it moves $1,369,430 out of pretax across the bridge at a 5.6% effective federal rate, and builds roughly $2.36 million in the Roth by 59½.
The lever is basis, not balance.
I plan on holding realized gain near 30%, and I want to be honest that I control that only partly. Specific identification lets me sell my highest basis lots first, but I cannot pick a number and hold it for twenty years. Land at 15% instead and the same plan converts $1,682,301 and clears the pretax account entirely by 59. At 30% I finish 59½ with about $562,000 still in there. That money still comes out, it just takes until 68, and at 65 Medicare removes the cliff and my room jumps to full bracket space. Either way there is no required distribution problem waiting at 75. The gain fraction costs me roughly $312,000 of converted volume and eight years of cleanup. It does not decide whether this works.
The arbitrage is the whole reason to bother. Moving $1,369,430 out of pretax at 5.6% instead of pulling it after 59½ at 22% saves roughly $224,600. At a 24% bracket it is $251,975. That’s not a rounding error on a plan this size, and it’s money you can only capture during the low income window between quitting and Social Security.
Now the hidden costs. This needs the biggest bridge of the three by a wide margin. The bare minimum that survives to 59½ is $1,624,283, and I am targeting $1.9 million, which leaves $743,514 on the table at the end. That gap is deliberate. A plan that lands on zero in year twenty has no room for a bad decade, and sequence risk is the one thing I cannot manage my way out of. It’s the highest effort option by far, because filling the room without crossing the line means running the numbers every year for two decades. It also assumes the cliff sits roughly where it sits now, which is an assumption. We all know what assuming does.
So this is what I’m doing, and I’ll say why it fits me rather than pretending it generalizes. Our spending is high enough that the ladder alone can’t carry it under the cliff, and I have years of runway to manage basis before I quit. If you spend $60,000, ladder first gets you out the door on a third of the bridge and you should take that deal all day.
My personal floor is still fifteen years of spending in taxable before I’d walk. I’d rather hold too much than too little, and a large brokerage account never becomes a problem later, because it keeps working in my sixties and seventies too. Worth noting that floor and the modeled minimum landed within $175,000 of each other, which is the first time my gut and my spreadsheet have agreed on anything.
There’s one more limit worth mentioning. Every number here assumes a 5% real return. Ben Carlson went and found the worst long stretch US stocks ever produced, a 22 year run ending in 1982 that returned “just 1.4% per year” after inflation. Land in something like that and every bridge in the table needs to be roughly a third larger. That’s the same reason sequence of returns risk hits early retirees harder than anyone else.
Your Move This Month
Four steps, one sitting.
One, write down real annual spending including your actual marketplace premium, not the payroll deduction you’re used to. Two, compare that number to your cliff, which is roughly $84,600 for two and $128,600 for a family of four in 2026. Under it, you’re a ladder-first candidate and your bridge is small. Over it, you’re subsidy-first and your bridge carries the difference for the full span. Three, subtract your current taxable balance. Four, divide the gap by your years remaining and set the auto transfer on payday. Then, it runs itself.
If the gap looks brutal, you have three levers and only three. Time in the market, contributions, and rate of return. In the withdrawal phase those same levers run backward, which is exactly why this gets sized before you leave instead of after. Push on contributions first, because it’s the one you own outright.
And start the taxable account earlier than feels necessary. I reached Coast FIRE, felt good about myself, and kept feeding tax advantaged accounts for another year or two before it clicked that flexible money was the actual constraint. Learn that cheaper than I did.
Get the 10 Quiet Mistakes That Kill Your Early Retirement. Slow leaks that add years to your timeline without ever getting noticed. Number ten is waiting to be serious, which is the one that cost me the year or two I just described. Every mistake comes with the numbers behind it. Send me the guide
Free, email only.
Questions About Bridge Account Sizing
What’s the Smallest Bridge I Can Retire Early With?
Five years of spending, and only if the rest of your money sits in pretax accounts you can convert. That’s the seasoning window on your first ladder rung. In the model a couple spending $60,000 clears it with roughly $423,000. What five years doesn’t buy you is room to be wrong, because one bad market inside that window has you converting into a drawdown with nothing behind it.
Should I Stop Maxing My 401(k) to Build the Bridge Faster?
Take the full match first, always. After that it depends on which strategy you’re running. Ladder first needs a small bridge, so keep stuffing pretax. Subsidy first needs a large one, and at some point the taxable dollars matter more than the deduction. The earlier you plan to leave, the sooner that flips. If your plan allows after tax contributions, a mega backdoor Roth sits between those two options and hands you basis you can reach at any age. Your other options for reaching retirement accounts before 59½ exist too, they just come with strings that taxable money doesn’t have.
Isn’t a Taxable Brokerage the Worst Account for Taxes?
Only if you trade it. Hold longer than a year and long term rates apply, and in 2026 a married couple can stack the $32,200 standard deduction and $98,900 of gains for $131,100 realized at a 0% federal rate. On top of that, selling shares only surfaces the gain as income while the basis comes back untaxed, which makes taxable the most MAGI efficient spending source an early retiree owns. Full version in the zero tax article linked above.
How Should the Bridge Be Invested?
Most articles on this recommend 60/40 or 70/30, which is fine for a 52 year old with a seven year window and expensive for a 40 year old with 19.5 years. The back half of that money doesn’t get spent for fifteen years. Hold the near term slice conservatively if it helps you sleep and let the rest stay invested for growth. I put an actual number on that slice, and it is smaller than any allocation chart will tell you.
Does the 4% Rule Tell Me My Bridge Number?
No, and confusing them causes real damage. A withdrawal rate answers what your whole portfolio supports each year. The bridge question asks how much of it you can legally reach before 59½. You can clear your total number to retire at 40 and still be stuck, because the money sits in the wrong container.
A note on the numbers. Every dollar figure here comes from a year by year model I built and ran myself, not from a study, and every assumption behind it appears in the chart caption. Premium data comes from KFF and the federal age curve from CMS. Tax figures are 2026 and will change. Real returns are assumed, never guaranteed. I’m an engineer building this plan for my own family, not a licensed advisor, so treat this as education rather than advice.